A8 Analytics
What is Grafana?
Grafana is an open-source platform for data visualization, monitoring, and analysis. Our company uses this tool by pairing it up with Graylog for monitoring technical state of software systems that we use internally or build for our customers. Grafana allows users to create dashboards with panels, each representing specific metrics over a set time-frame. Every dashboard is versatile, so it could be custom-tailored for a specific project or any development and/or business needs.
We mostly use Grafana with Elasticsearch and InfluxDB, but there is a variety of other supported data sources (Prometheus, MySQL, Postgres to name just a few) for this software. For each data source, Grafana has a customized query editor and specific syntax.
User Metrics
As everyone knows, the Grafana project began with a goal to make the dashboarding experience better for everyone, and to make it easy to create beautiful and useful dashboards like the one mentioned below.
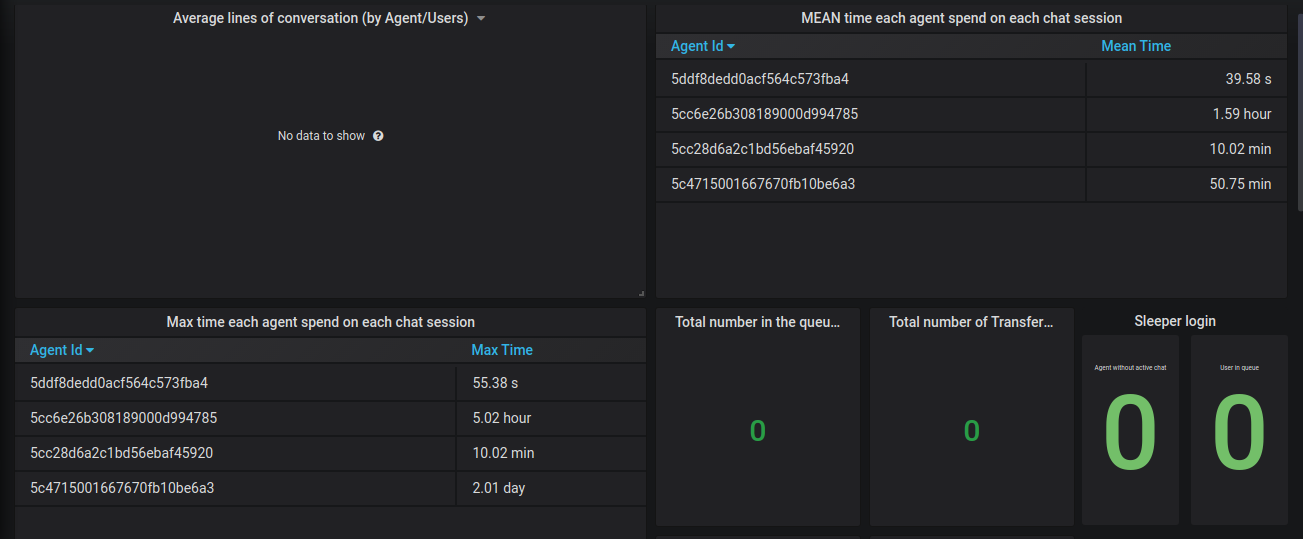
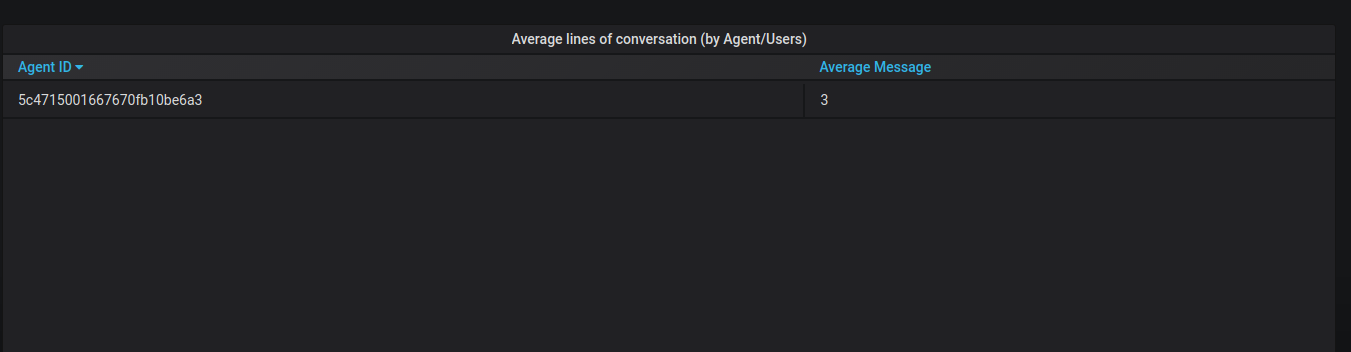
Average Lines of Conversation (by Agent/Users)
This panel displays the average lines of conversation between an user and agent-based on each agent. The calculation is done on each agent with all chat sessions with users. If the chat is transferred back to the Bot from the agent, we won't be able to see the count on the dashboard.
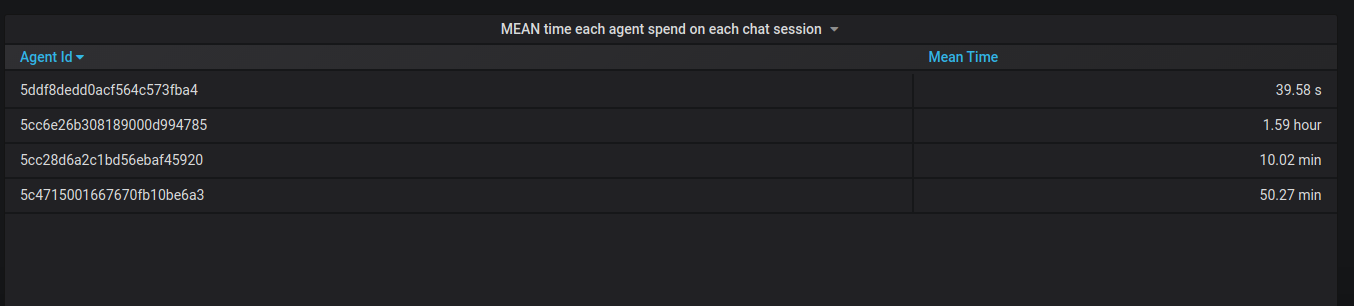
Mean Time Each Agent Spent on Each Chat Session
This dashboard displays the MEAN time of each agent that spends on the chat session. This calculation is done on each agent who spend time on all chat session with the users.
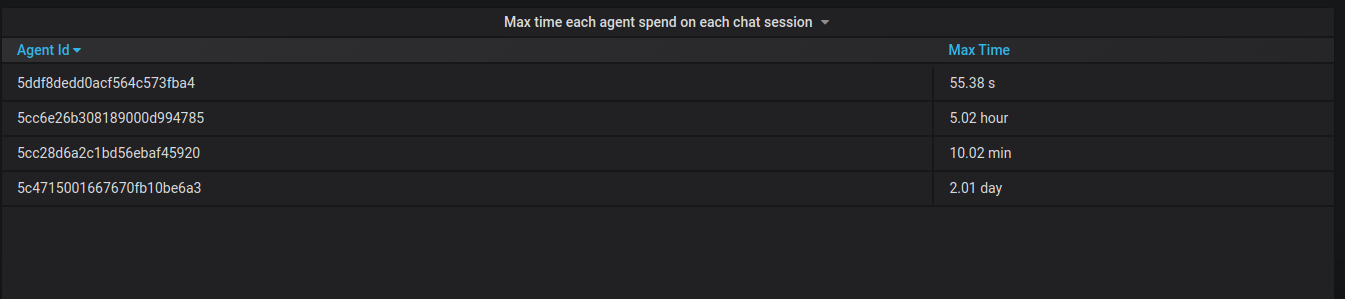
Max Time Each Agent Spent on Each Chat Session
In this dashboard, we can see the MAX time of each agent spend on the chat sessions. The calculation is done each agent and finds the chat session where max time spend with users.
Total Number of Users in Queue
This is used to display the total number of users that are in the Queue for the Live Agent console.

Total Number of Transfers to The Agent
This panel displays the total transfers done to the live agent.

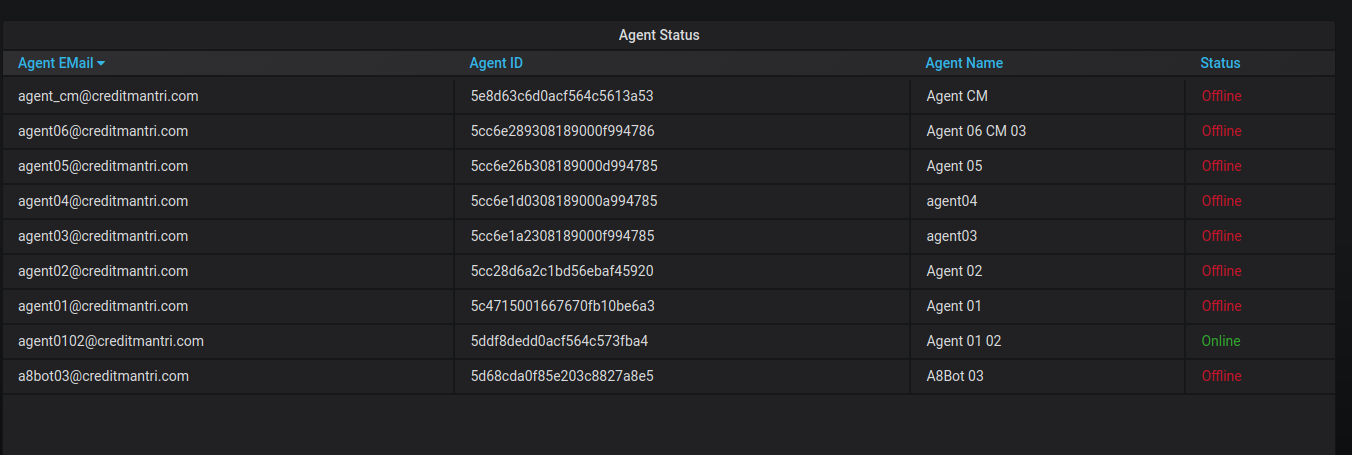
Agent Status
This panel displays the list of the live agents along with theie statuses, whether they are online or offline. It shows their details like agent ID, agent name, and agent email.
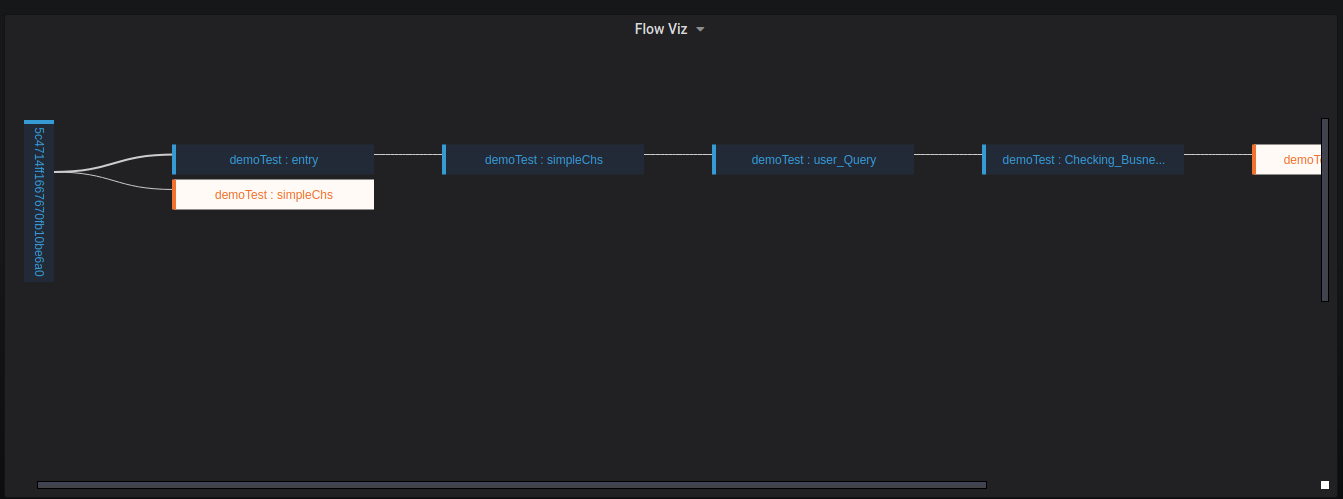
FlowViz
This custom panel is developed by Autonom8. This panel helps to track the nodes that were traveled in the Flow and it is also used to monitor the usage of the users in the Bot, like which flow or intent is frequently by the user and where the user drops in the chat. When we hover the mouse over on every node in the flow, we can see the weightage in percentage as how much the user is using the intent or event in the Botpress.
Total Number of Chats Handled by Agents
This panel displays list of chats handled by an agent currently. We have allowed two minutes as idle time. If the agent or users don't reply in two minutes, then chat will be unhandled.

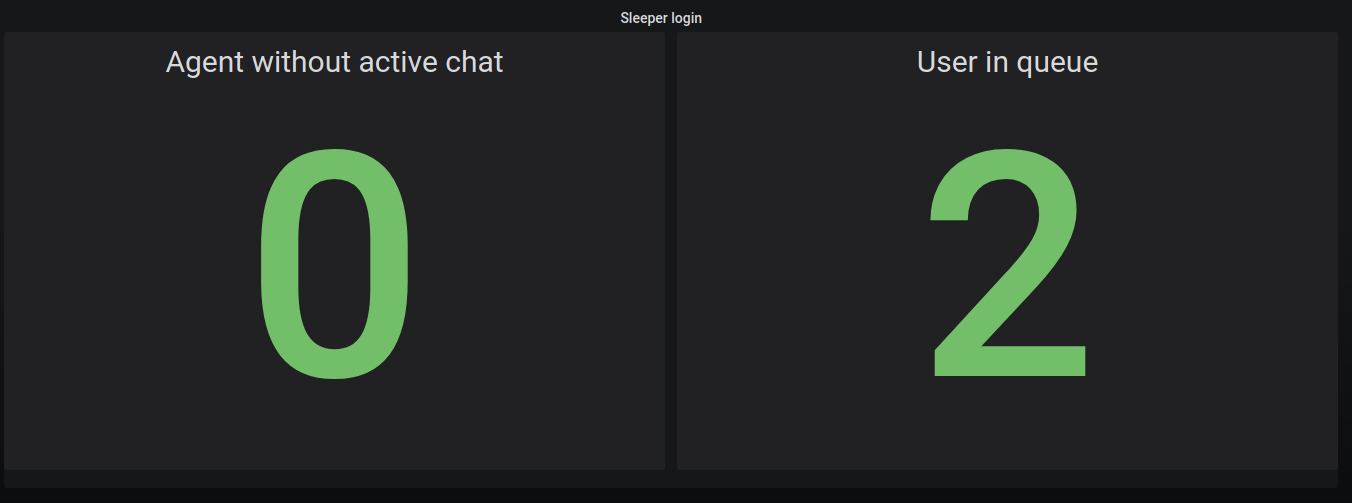
Sleeper Login
This panel displays the total number of agents without chat sessions with the users and total number of users waiting in the live agent queue.
- Agent without active chat
It is used to show the total number of Agents active in giving the response to the users.
- User in queue
It is used to show the total number of chats in the Agents' Queue.
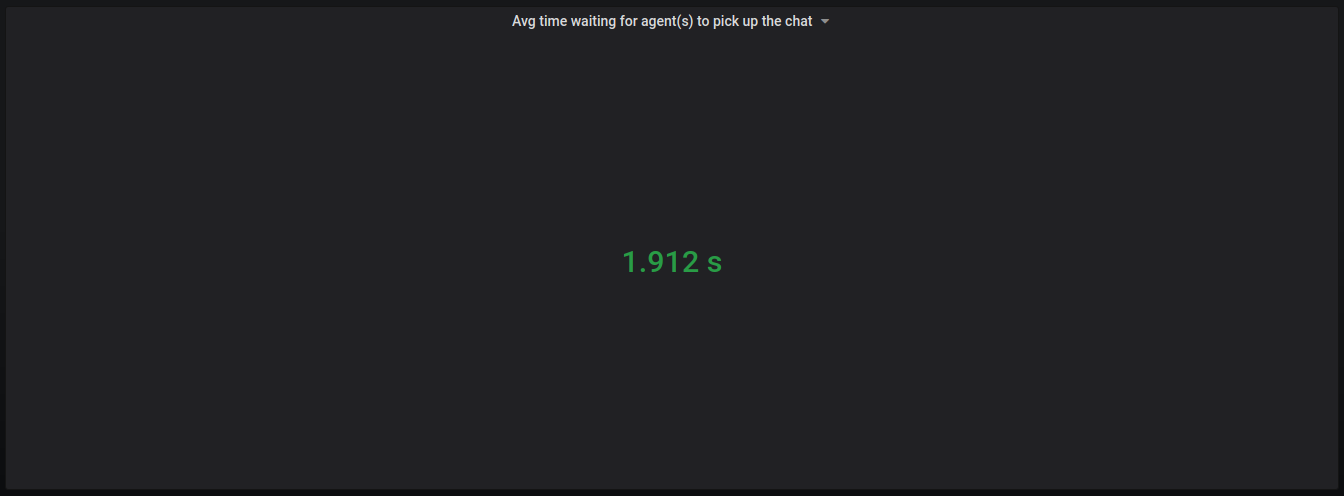
Average Waiting Time for Agent(s) to Pick Up The Chat
This panel display the average waiting time for user to start the chat with agent.
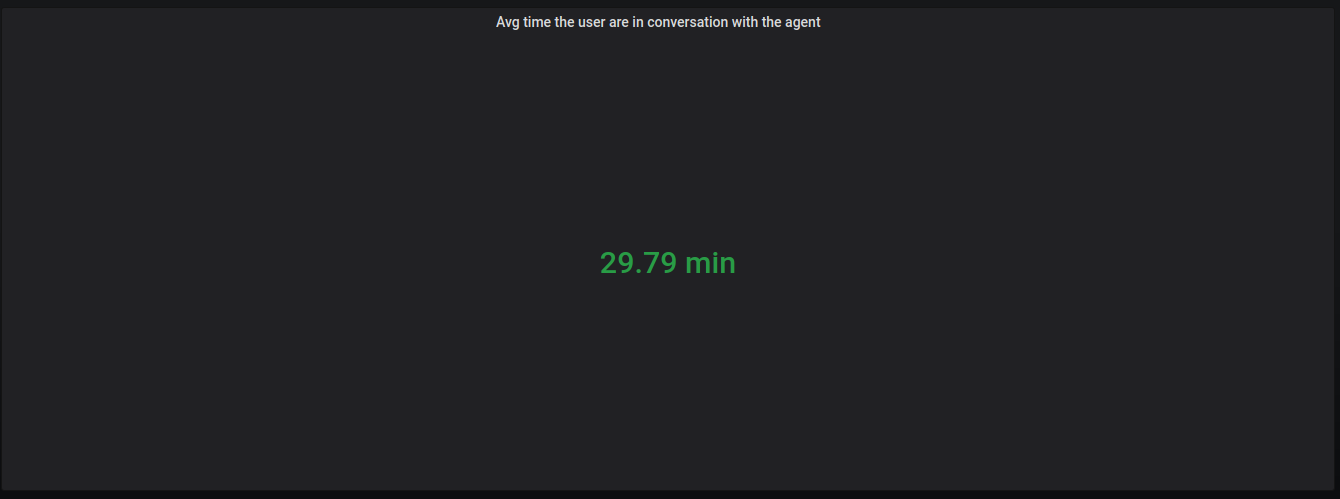
Average Time The Users are in Conversation with the Agents
It is used to determine the total time duration the user is interacting with an Agent.